From time to time we will need to figure out why something is not working correctly.
Adding a WordPress debug plugin is one method. Another is editing the wp-config file as well as how to fix errors on updating a plugin or theme in WordPress.
Here I am focusing on plugins that can help.
WP Debugging
Query Monitor
Health check and Troubleshooting
WP Debugging
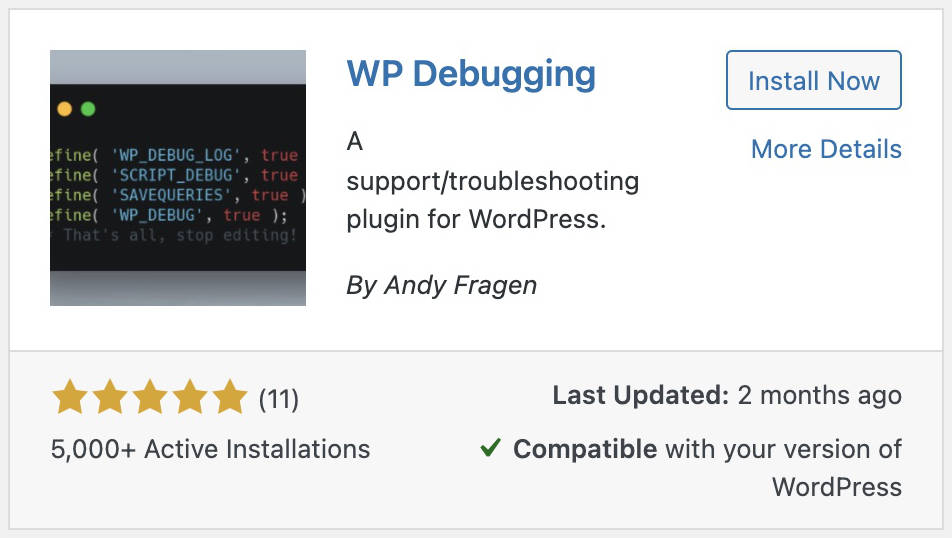
The WP Debugging plugin will turn on the debugging mode in WordPress. Upon activating WP Debugging the following will be added into the wp-config.php file. Upon plugin deactivation these will be removed.
define( 'WP_DEBUG_LOG', true );
define( 'SCRIPT_DEBUG', true );
define( 'SAVEQUERIES', true );
When WP Debug Log is turned on. If there is an error it will be added to the debug.log text file located inside the wp-content folder. It is then possible to copy and paste the error into the browser window to see if it is possible to find an article about the error.
When Script Debug is turned on. It will tell WordPress to load all files as full (development) versions instead of the packed/minified version. Loading the full version of CSS and JS files will make it easier to find a possible error.
When Save Queries is turned on. It will list each query, how long it took the query to run and what function called it.
The plugin Settings page allows the user to set the following.
define( 'WP_DEBUG', true ); // Default on initial plugin installation.
define( 'WP_DEBUG_DISPLAY', false ); // Default when not declared is true.
define( 'WP_DISABLE_FATAL_ERROR_HANDLER', true ); // WordPress 5.2 WSOD Override.
When WP Debug is turned on. It will trigger the debug mode throughout WordPress.
When WP Debug Display is turned on. Error message will be seen be seen directly in the backend as they are generated. Turning this off and WP_DEBUG_Log to true will instead show the errors in the log file.
When WP Disable Fatal Error Handler is turned on. It will disable the fatal error recovery feature introduced in WordPress 5.2. No e-mails will be sent out.
WP Debugging plugin recommends installing Query Monitor and Debug Bar plugins to aid in debugging and troubleshooting.
Resources to take a closer look at:
https://pixify.net/blog/debug-wordpress-plugin-issue/
https://pippinsplugins.com/use-script_debug-enable-non-minified-asset-files/
https://codex.wordpress.org/WP_DEBUG
https://wp-qa.com/wp_disable_fatal_error_handler-vs-wp_debug-what-to-use-and-when-to-use-to-see-errors
Query Monitor
The Query Monitor plugin is the developer tools panel for WordPress. It enables debugging of database queries, PHP errors, hooks and actions, block editor blocks, enqueued scripts and stylesheets, HTTP API calls, and more.
It gives an idea of what areas to improve as it shows resource usage, page load time, number of active queries on a page, can show theme and plugin problems and as well as other queries.
Query Monitor Overview
There are two ways to open the Query Monitor settings.
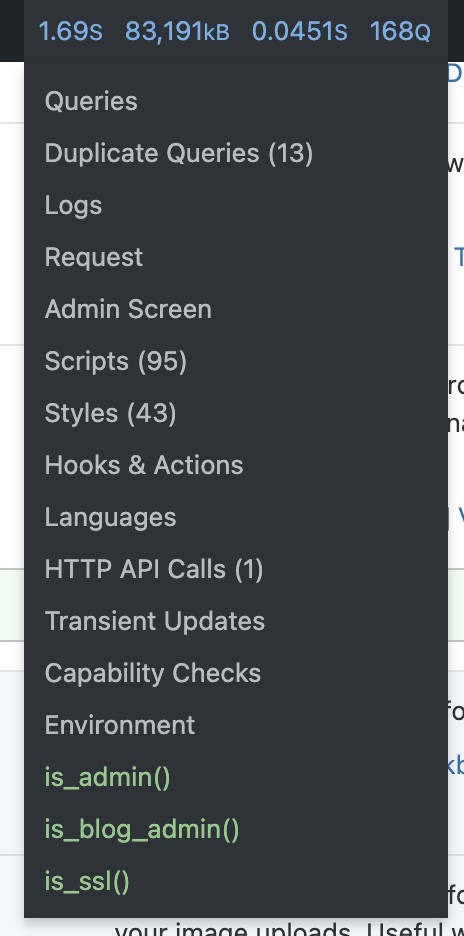
1- Click the numbers seen in the top black admin bar and select one of the options.
2- Go to Installed plugins. Click Settings text link below the Query Monitor plugin title.
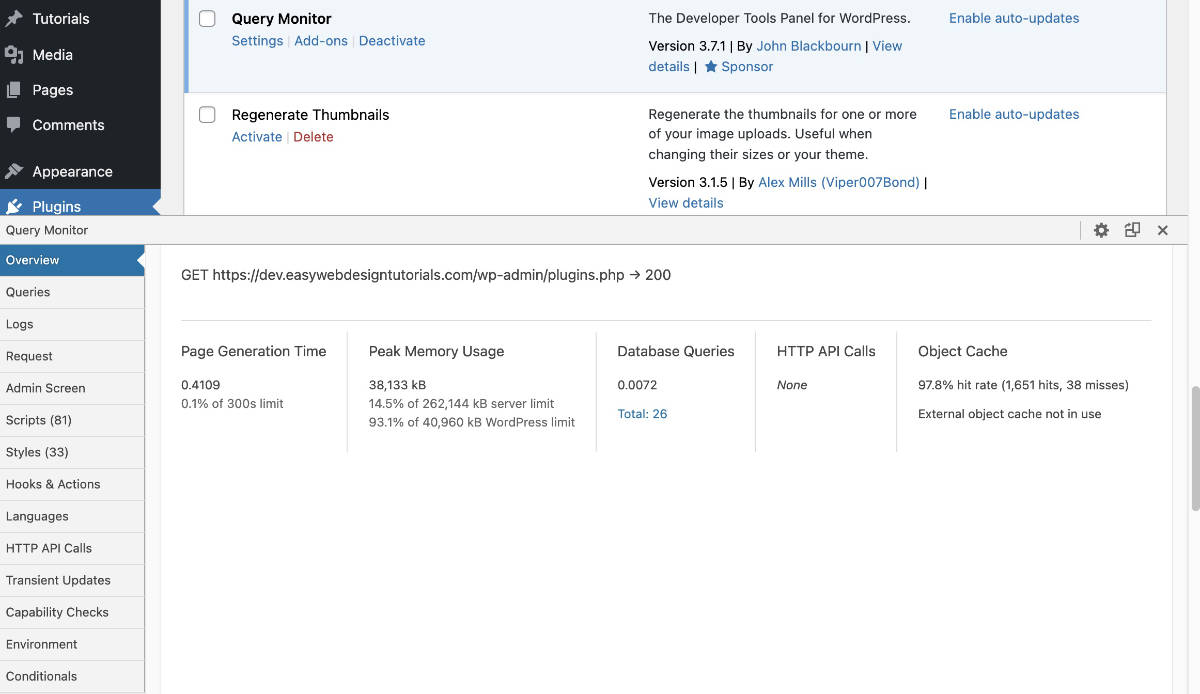
Clicking settings will show an overview on the bottom of the screen. The Overview screen shows the Page Generation Time, Peak Memory Usage, Database Queries, HTTP API Class and Object Cache.
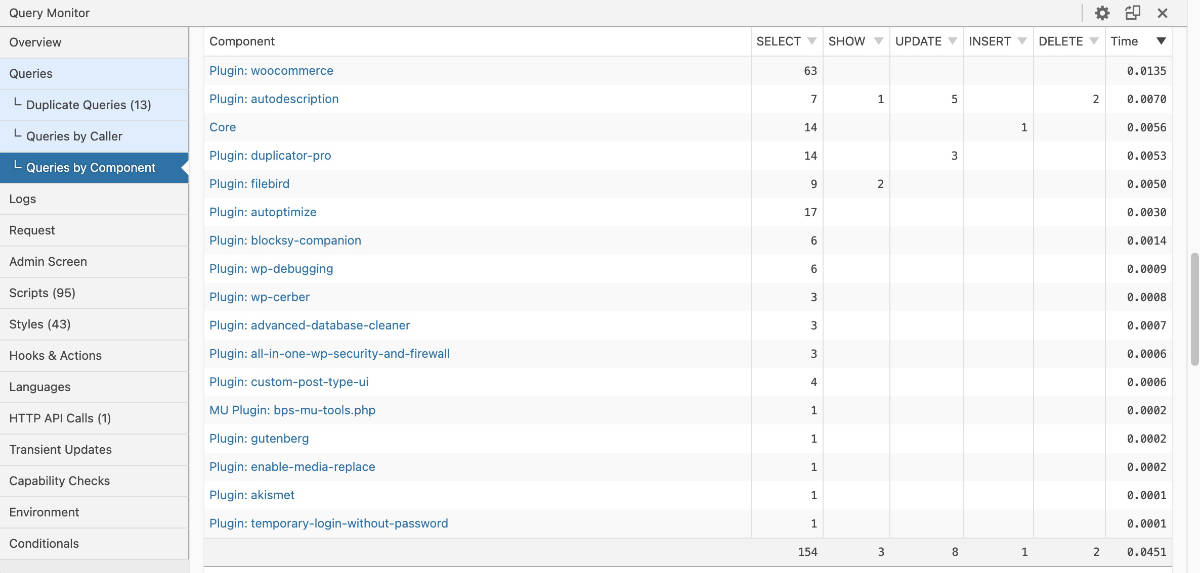
Here is an example for checking Queries by Component. It shows how long it takes a plugin to load. The smaller the number the faster it loads. Example WooCommerce is on the top of the list because it has a higher complexity and handles many actions compared to most other plugins. This makes it slower to load.
Resources to take a closer look at:
https://www.cloudways.com/blog/wordpress-query-monitor/
https://kinsta.com/blog/query-monitor/
Health Check and Troubleshooting
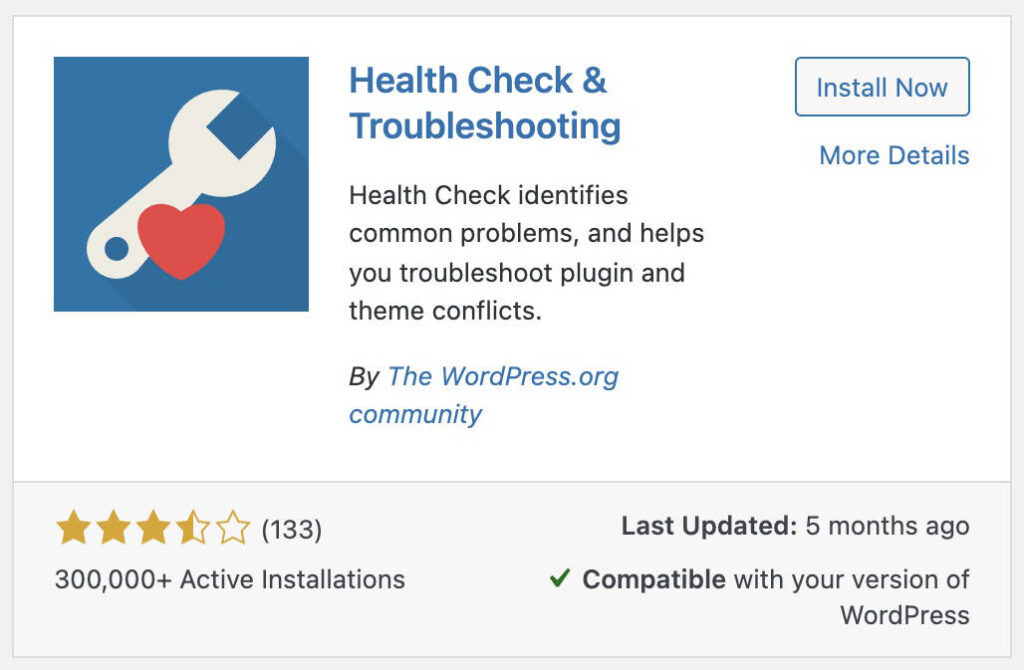
Health Check plugin helps with troubleshooting common problems with web sites, and to provide debug information to help with identifying problems with site setups.
Under Tools > Site Health. Then going to Troubleshooting.
WordPress core also has a Site Heath section, but it shows the Status and Info area, and does not show Troubleshooting and Tools.
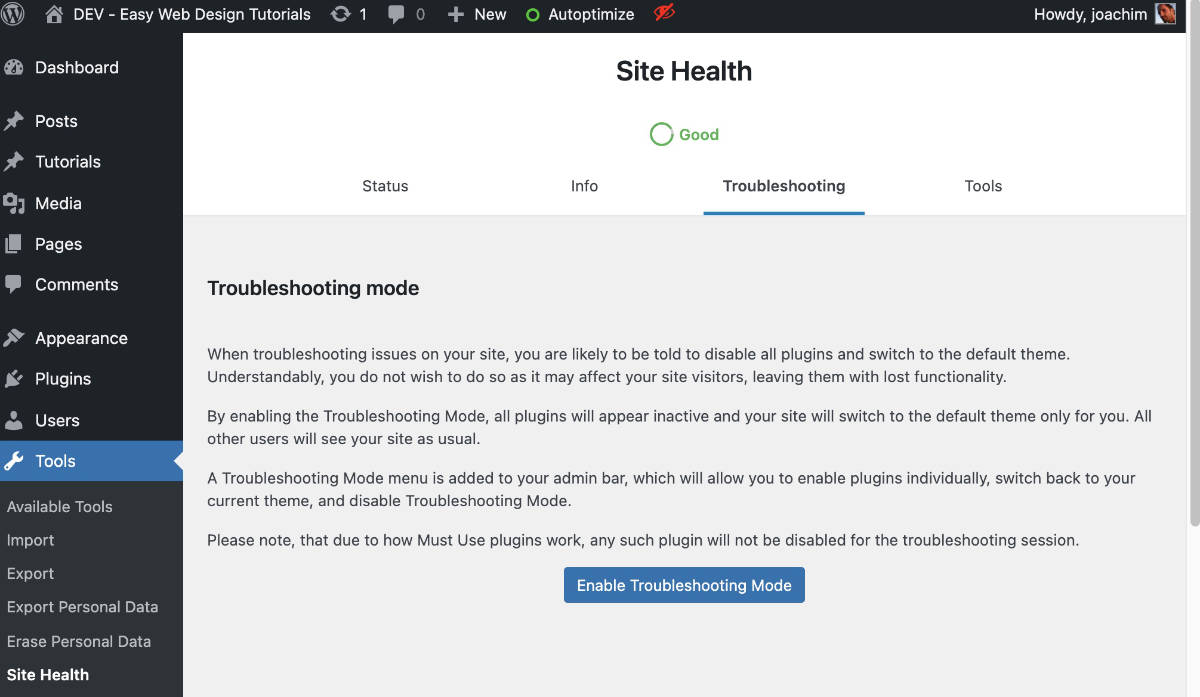
In the Troubleshooting screen one can Enable Troubleshooting Mode, and it will turn off all plugins and activate the default theme only for the user who has logged in. For everyone else the site is seen as it normally does.
Tools: Checks File integrity, Mail Check and Plugin compatibility.
Resources to take a closer look at:
https://make.wordpress.org/support/handbook/appendix/troubleshooting-using-the-health-check/


